Instinct Environmental Company
From spreadsheet to web application, increasing GIS analyst task efficiency by 65%.


My role
Lead UX/UI Designer
User Researcher
Usability Testing
Client Success Liaison
The team

Problem
Land management companies like Weyerhaeuser and Stimson—two of Instinct's largest clients—were struggling to keep track of data relating to soil health, temperatures, humidity, and more. Instinct's new sensors were bringing in real time data to GIS analysts, but the data spreadsheets were difficult to read and interpret.

Research
Instinct's sensors had very few competitors. The companies that did similar work were researched and insights were gathered into a competitive audit.
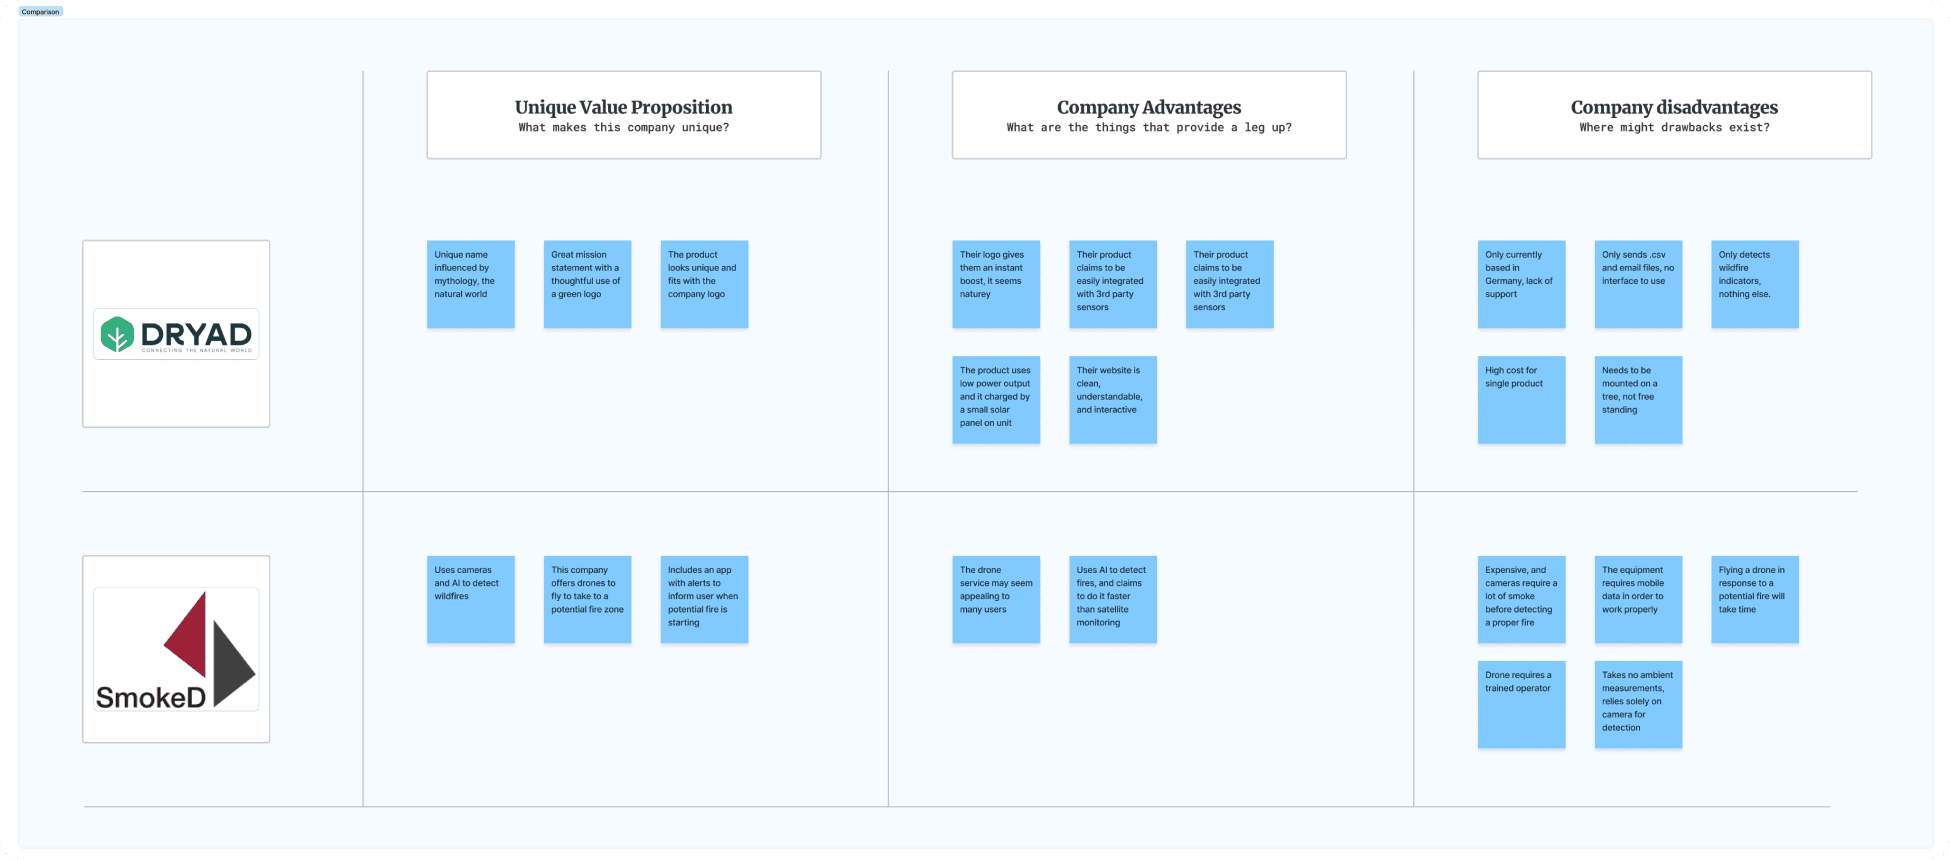
Insights
After the audit, three key insights were made.
No other known company had its own interface for the user to interact with and customize.
Instinct's live data feedback was unique, providing data much faster than other competitors.
Users had to manually enter data collected from one spreadsheet to another, there was no automation.
Considerations
After initial research was completed, it was time to begin the design process. Some design considerations were:
01
02

03

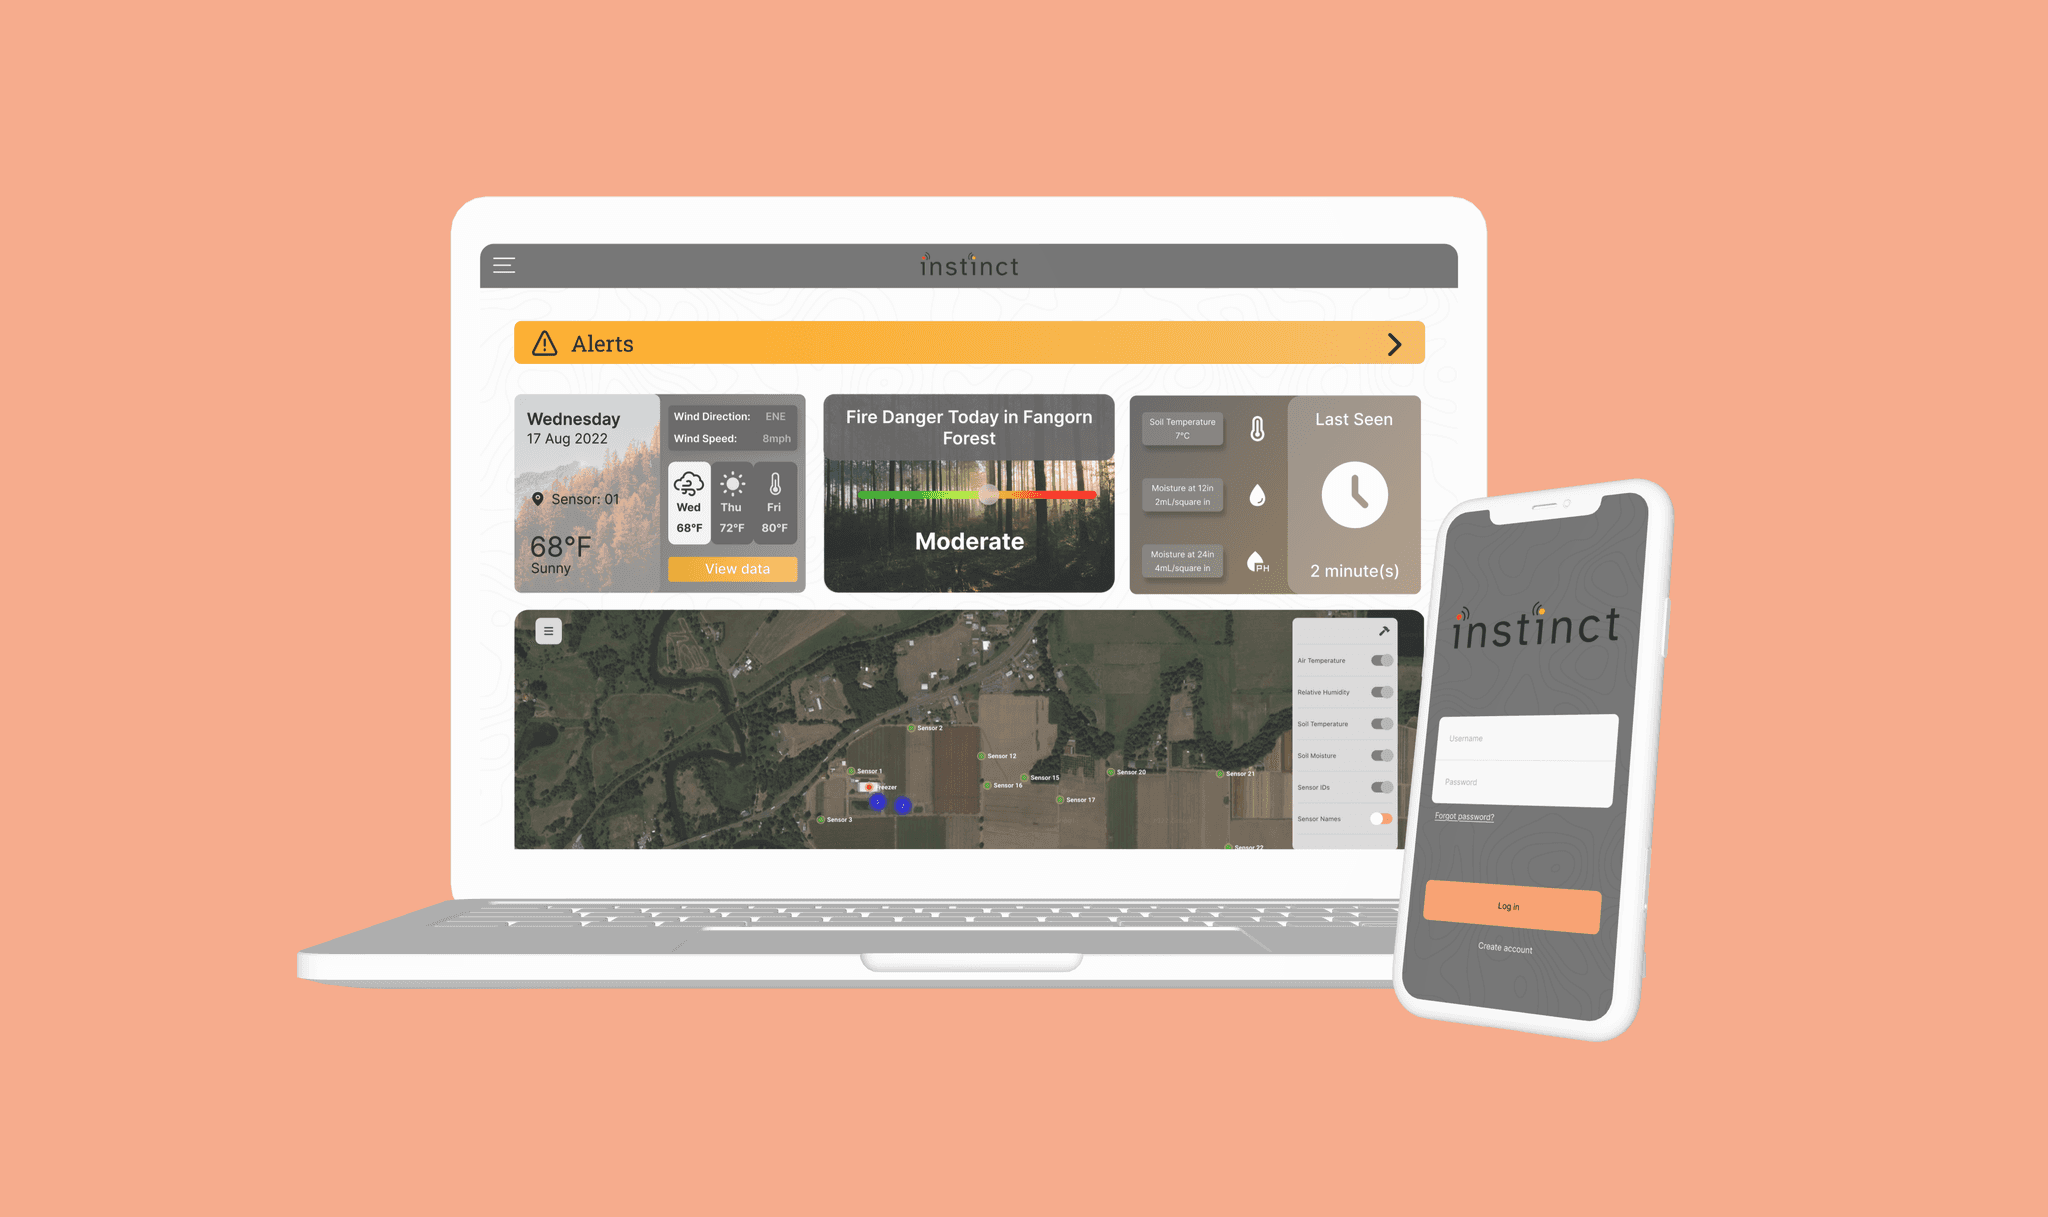
Conceptualization
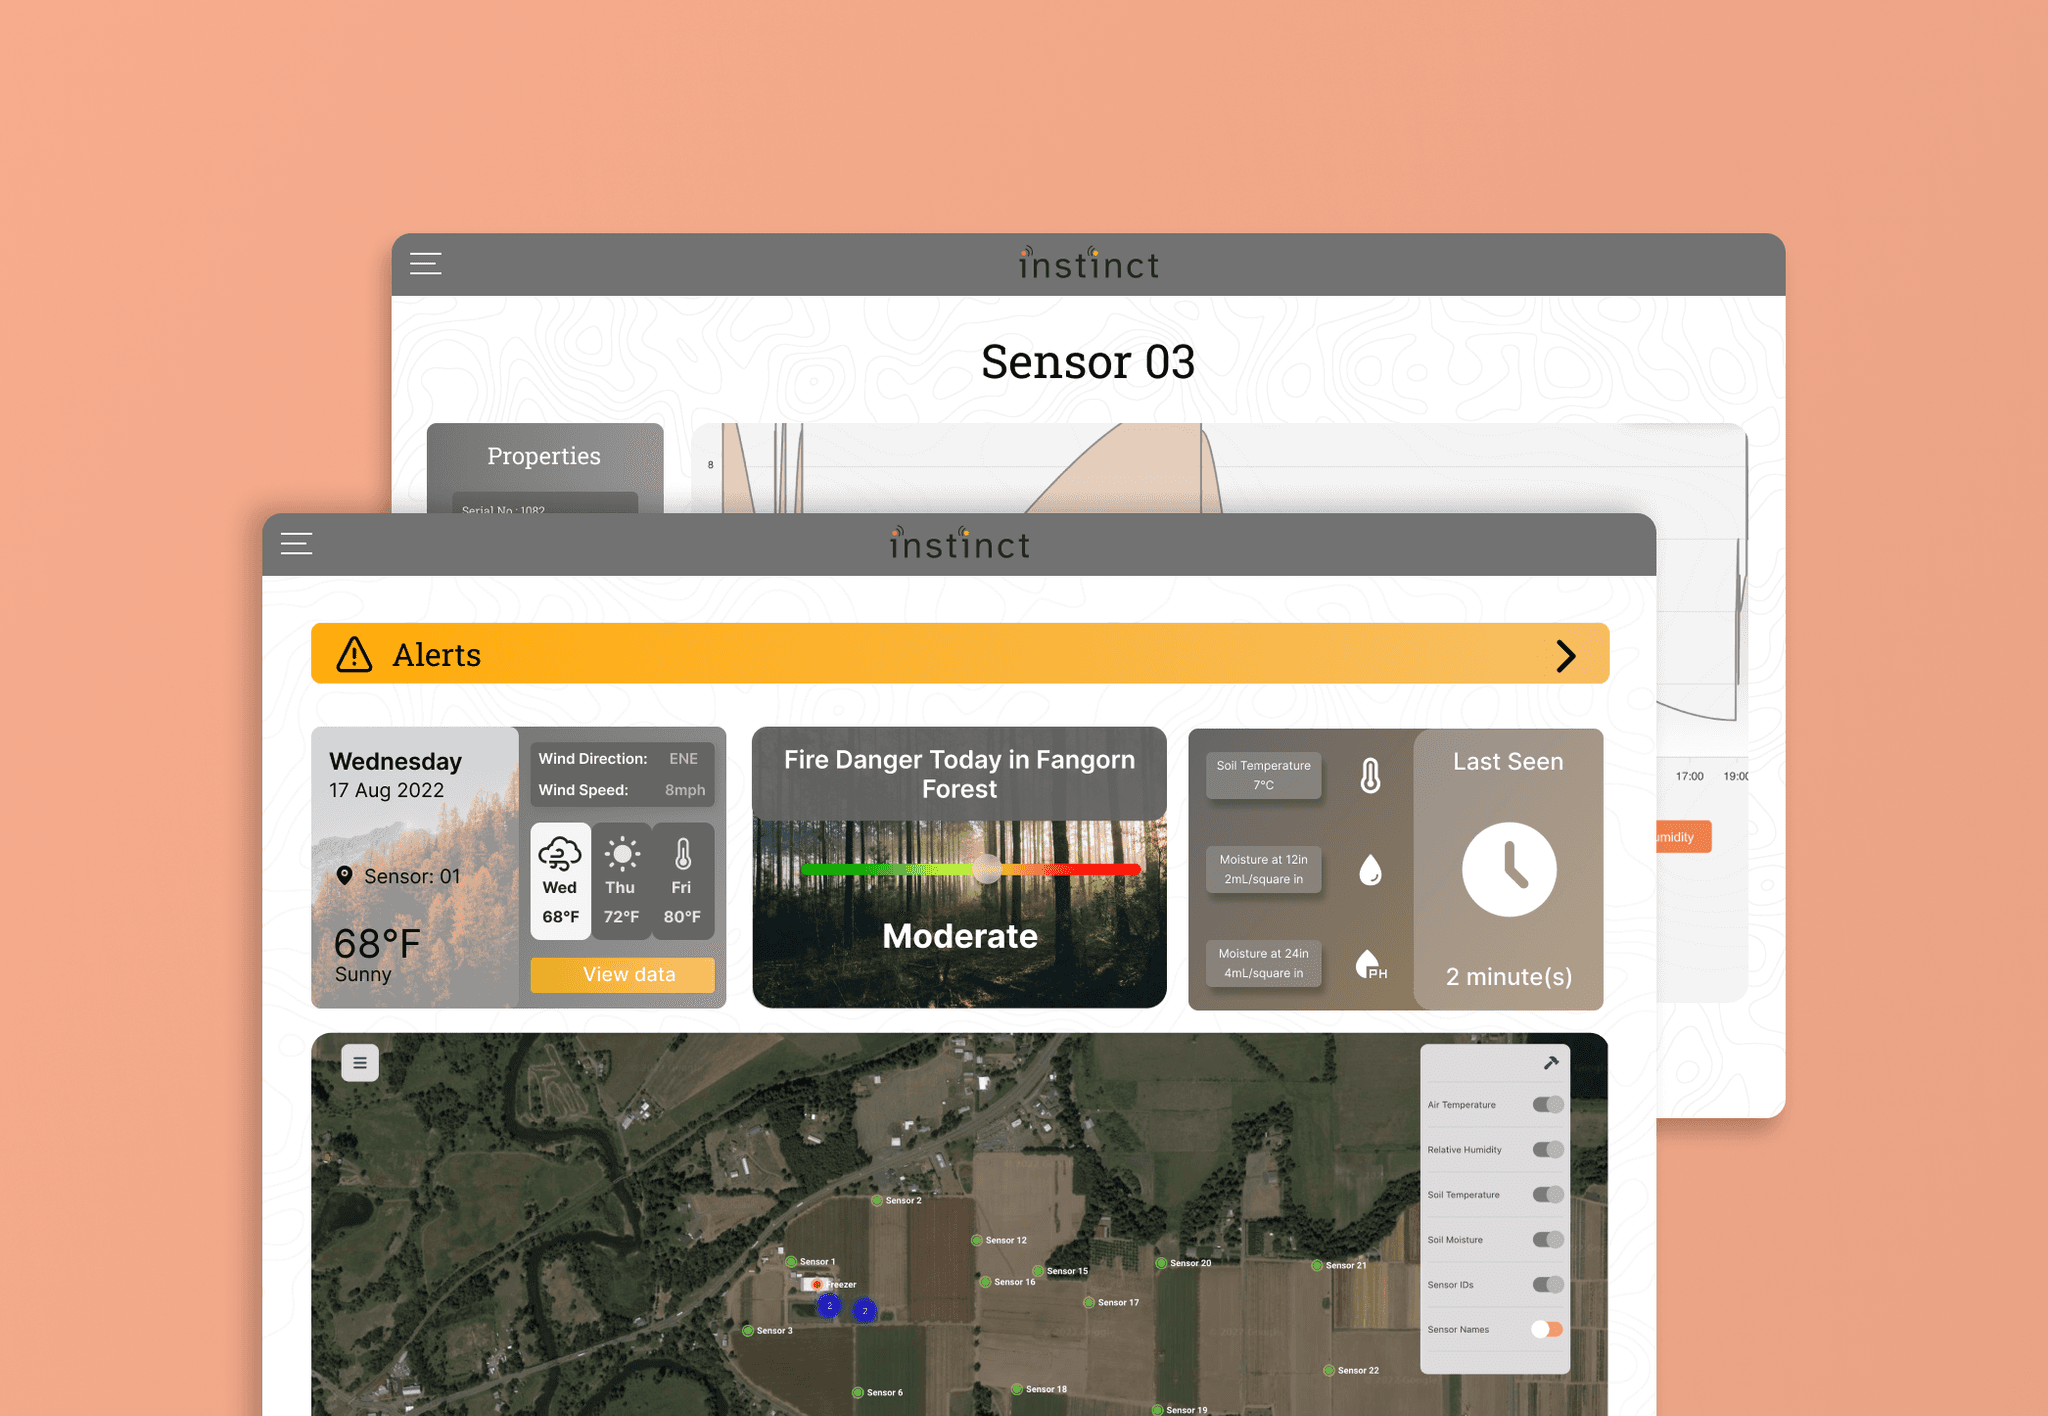
With the product considerations in mind, we began work on wireframes. We needed to keep things simple and clean. Since Instinct contracted with Weyerhaeuser for a proprietary web product, the team decided on a scalable, widget based design that included an interactive map, showing sensors and quick data. This would allow Weyerhaeuser to get the product they needed while allowing Instinct to scale this design and market to more clients.


Usability test
With wireframes completed, a basic usability test was run with a team on UserTesting.com. Once completed, wireframes were upscaled to high fidelity and sent to Weyerhaeuser users to run a test with their team. The feedback returned was encouraging.

Manuel
Heather
Michael
Dave
Jessica
Antonio
Insights & Iterations
Interactive map
The Instinct development team used Google Map's API for our interactive map. Icons were designed to show sensor locations and alarms. The team added a toggle filter to display different data across the map. We also added a hover overlay, showing sensor status and current readings.
Sensor Icons
Instinct's sensor communicate in a hierarchal network. Child sensors send their data to the parent, which sends data via satellite connection directly to Instinct's database.
Two sensor icons were designed to distinguish between the child and parent sensors.
Color variants were added to give the user a quick visual on sensor connection status.

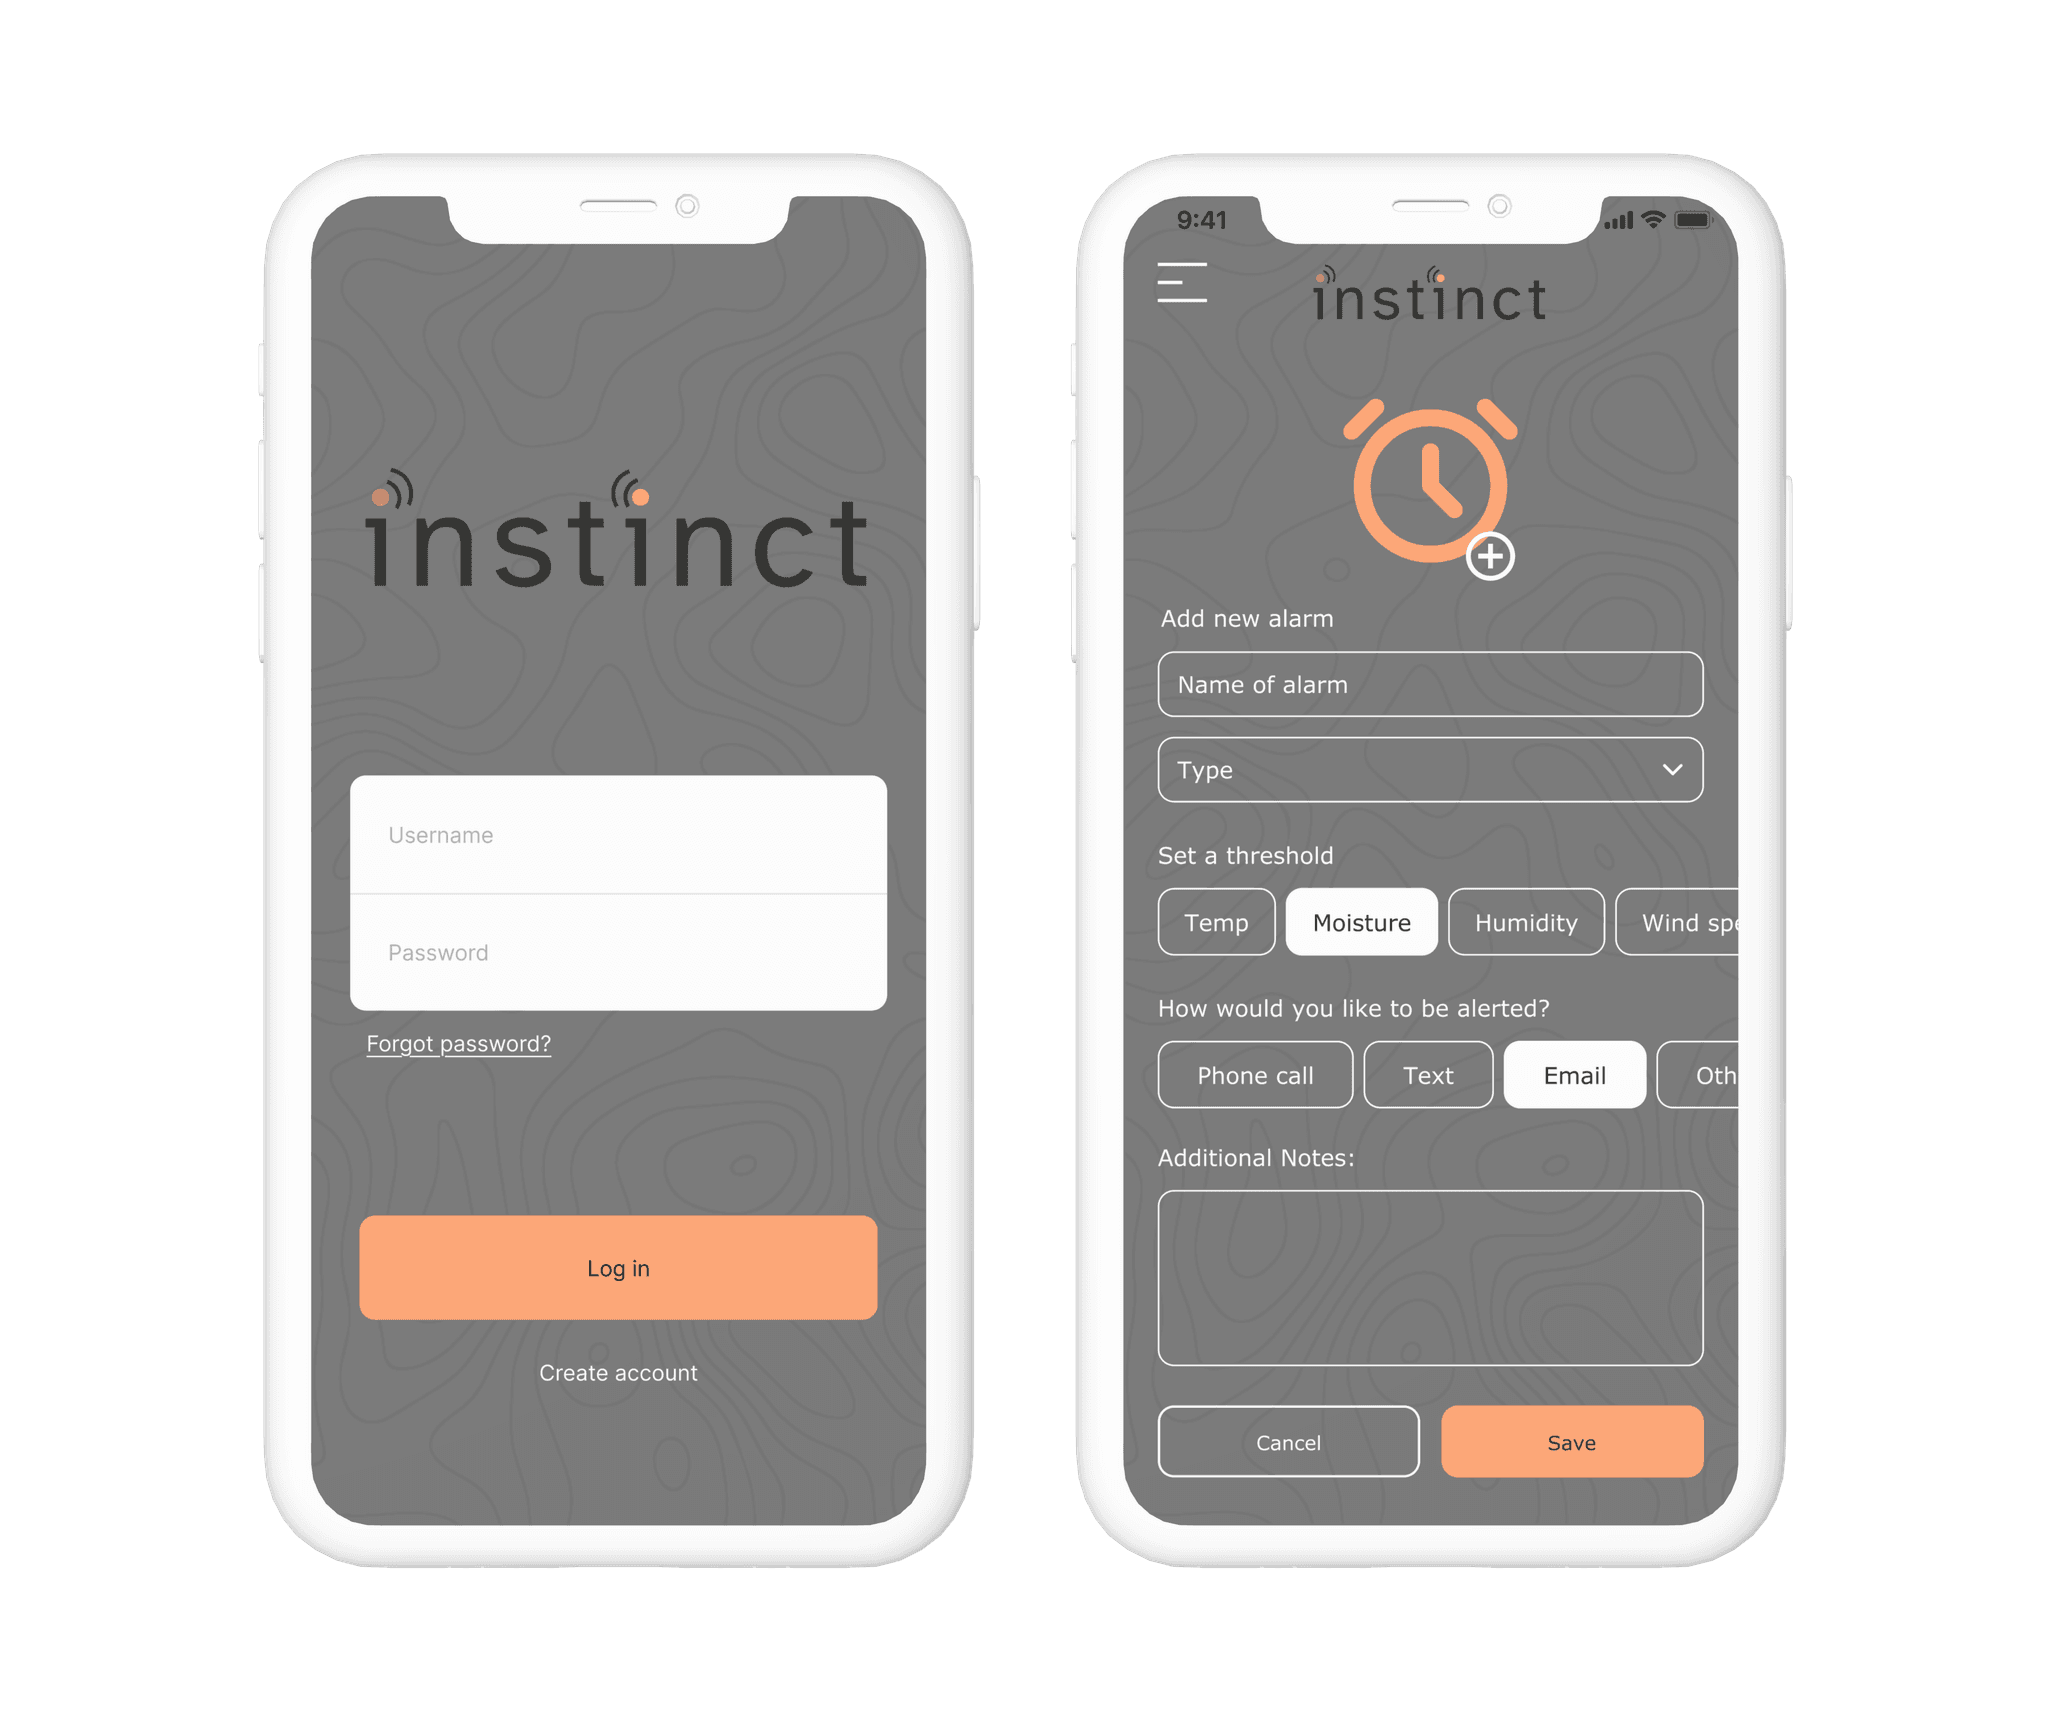
Mobile app
Our clients at Weyerhaeuser needed a system for their sapling nursery to alert their team when temperatures dropped too low. Their team asked for a mobile app to alert them via alarm, phone call, and text message when these alarms were triggered.*
*Due to an NDA I signed, I cannot show screens that share any data surrounding Weyerhaeuser's proprietary product.